Loading...


Uncover the numbers that drive decisions, shape markets, and tell the story of a sector in transformation.
Population Dynamics and Disease Patterns
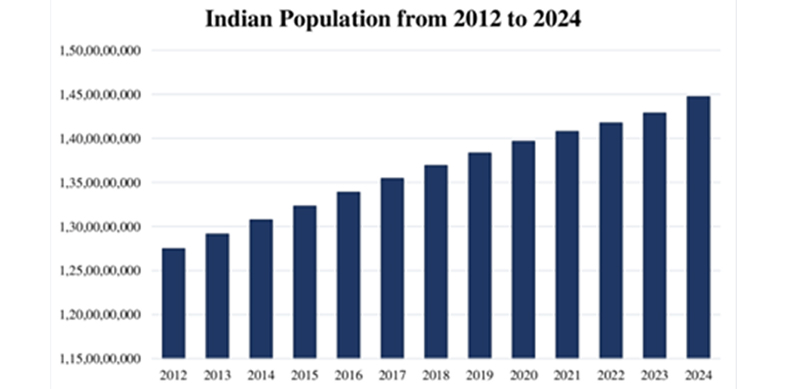
Population growth (2000–2024) – Line Graph – Our World In Data
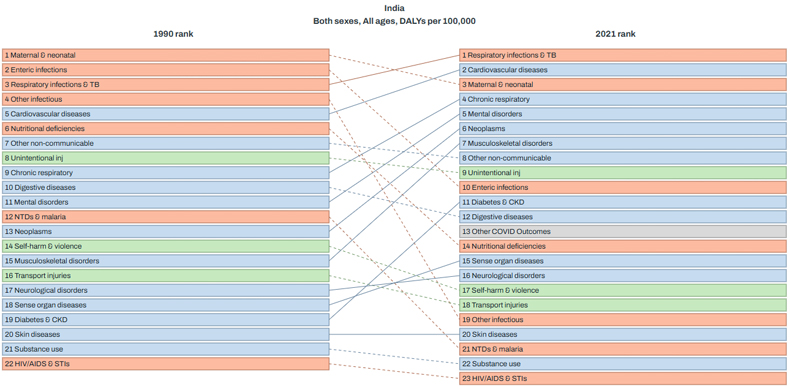
Acute vs Chronic Disease Burden – Pie Chart
India's healthcare system must serve 1.4 billion people while transitioning from treating primarily infectious diseases to managing chronic conditions like cardiovascular disease and diabetes – requiring a fundamental shift in infrastructure and care models.
India vs the World: A Health Systems Snapshot
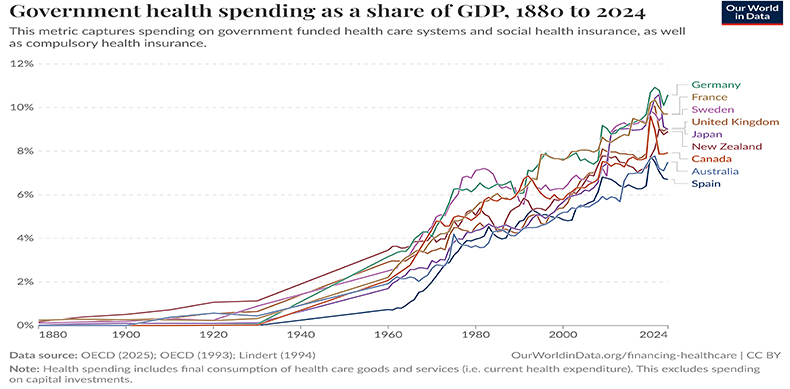
Govt. health spend (% GDP) – India vs US, UK, AUS, GER, CHN
Acute vs Chronic Disease Burden – Pie Chart
India spends approximately 3-4% of GDP on government healthcare (compared to 7-11% by developed countries) while graduating 110K+ doctors and 400K+ pharmacy professionals annually.
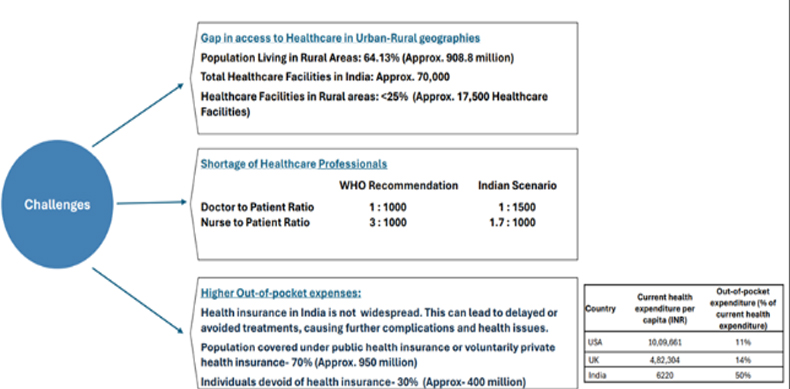
Challenges in Accessibility